
Pollution monitoring on the cheap?
Context
This work is being carried out using a Faculty of Social Sciences grant at the University of Kent, in the Centre for Health Services Studies (CHSS), led by Prof. Stephen Peckham, along with Canterbury Clean Air group. The project goal is to create a new particulate dataset for Canterbury and analyse any correlations with health data.
Who cares?
In the UK, it is estimated that air pollution contributes upto 40,000 excess deaths per year [1]. Even without health data to demonstrate the damage that air pollution has on us, it is pretty obvious that air pollution in cities:
- Stinks
- Makes the environment physically dirtier
- Is usually associated with noisy vehicles
So even if breathing in pollution was completely healthy, there would still be compelling reasons to switch to alternatives that either stop producing it or produce less of it.
What do you mean by pollution?
Whilst the term “pollution” is emotive and imprecise, it is also vernacularly well understood to be something that needs to be avoided, hence the reason for using it. However, when it comes to actually monitoring pollution, we need to be more specific.
PM 2.5 and PM 10
What we are interested in monitoring in Canterbury is particulates. Whilst “particulates” is a generic term for very small particles, there are two size categories that are most commonly monitored: PM2.5 and PM10. The actual definitions are quite nuanced and require discussion, but for the point of this article we will assume the general definitions below:
- PM2.5 - Particles which have a diameter of 2.5µ or less
- PM10 - Particles which have a diameter of 10µ or less
Measuring PM 2.5 and PM 10
There are two principle manners in which particulates are monitored:
- Separate, Filter, and Weight - This class of devices have a mechanism to separate the particles into specific size ranges, the particles are then captured in some kind of filter, finally the mass of the particles in the filter are calculated via some kind of balance or indirect method.
- Count and Classify - This class of devices are usually optical and count individual particles. They may use separation before counting, or estimate particle size via some other method.
Separation in case of the first class of devices is often acheived by use of an impactor separator. This device works by accelerating polluted air to a known velocity and then passing it around a 90° bend. Particulates that have too much momentum, can’t make it around the bend and “impact” into the wall of the bend. Thus the impactor separates out particles by size, assuming a certain mean density. This would typically be combined with a filter which captures the particles and which is periodically weighed to yield a measurement in micrograms per meter cubed of air.
There are few different ways to weight separated particles, the most common are:
- Beta Attenuation Monitoring (BAM) - In this case the separated particles end up on a filter strip, and the mass ending up there are estimated by how much beta particles from a radioactive source pass through the strip, relative to the start of the sample period.
- Tapered element oscillating microbalance (TEOM) - In this case the filter is attached to a tapered piece of quartz whose resonant frequency changes depending on the mass in the filter.
In the case of count and classify systems, they are almost exclusively optical and work on the principle of particles reflecting laser light onto a photodiode. This is described in more detail below.
Design of a portable PM 2.5 and PM 10 measurement system
Constraints
The design was subject to several constraints:
- Cost - We had a £5K grant from the social sciences faculty to buy equipment and pay for my time. Thus a trade-off existed between buying the parts to build the thing, and buying the time to put the thing together. Therefore we couldn’t afford to invest time in complex design, minimisation, or sophisticated equipment.
- Accuracy - There isn’t any point monitoring particulates “on the cheap” if the figures obtained don’t display reasonable equivalence to the more expensive incumbents. It was necessary therefore to ensure that for whatever particulate monitor was used, there existed compelling evidence indicating it was accurate enough to make meaningful statements about the results.
- Portability - The device had to be portable because the aim was to monitor locations around Canterbury with a small group of volunteers.
- Simplicity - In order to maximise the utility of volunteers, the device needed to be as simple as possible to operate and obtain results, without compromising the cost constraint.
Particulate monitor
For monitoring of particulates we used the Dylos DC1700 portable optical particle counter.
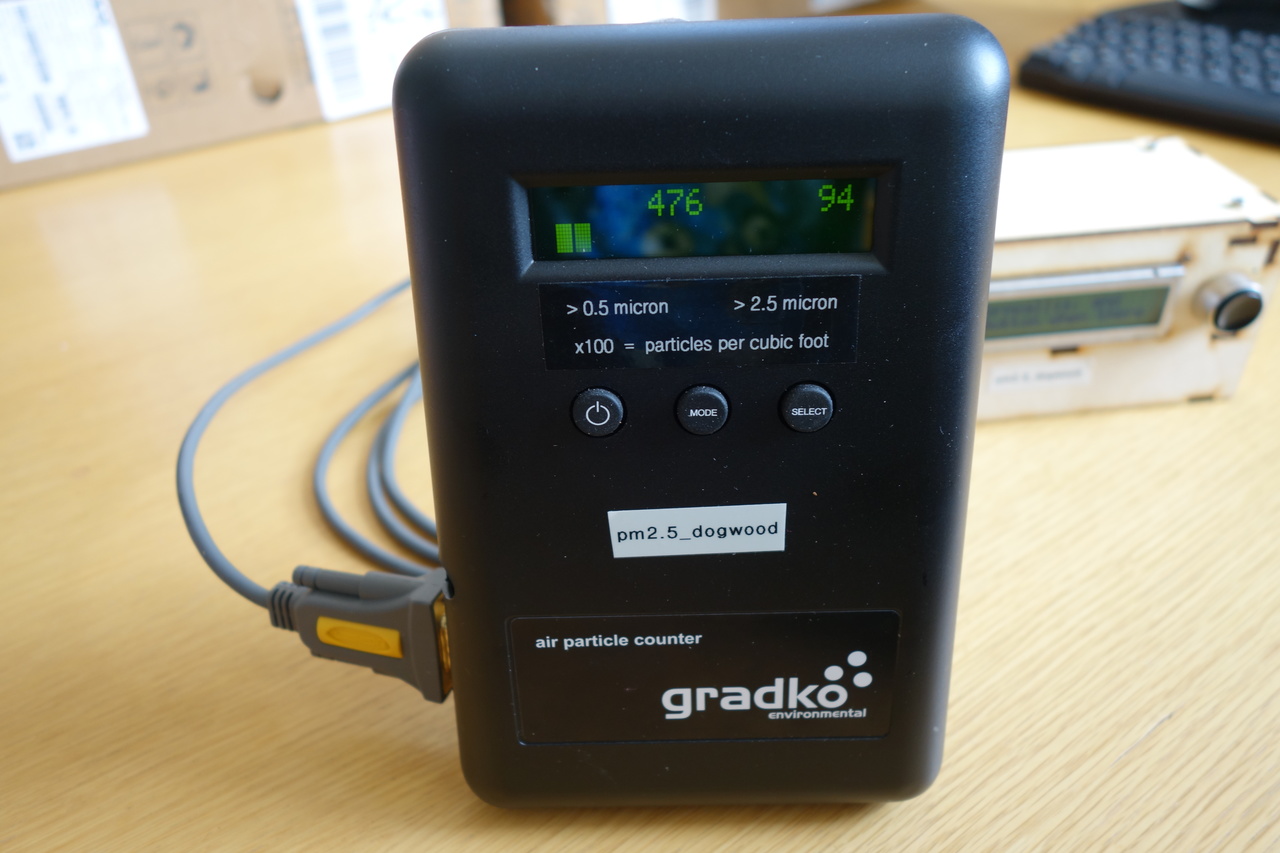
There is much more to say about the suitability of this particle monitor, but in summary this was the only “cheap” particulate monitor that appeared in peer reviewed literature with direct in-situ comparison against a real DEFRA site [2].
Cheap in this context is relative: the type of equipment DEFRA uses comes with a £5K - £15K pricetag whereas the DC1700 costs £522.00 including VAT in the UK, and something like $425.00 in the USA. This is still far too expensive for generalised mass monitoring.
The Hybrid Ecologies Lab at UC Berkeley in the USA is making fantastic progress in reducing the cost of particulate sensors, having created a matchbox-sized personal PM10 monitor for only $75 as well as creating their own monodisperse particle generator and calibration chamber.
We didn’t have the budget to build this both in terms of time and initial equipment investment, and it didn’t exist when we created the project. In my opinion it is however the way to go in the future, but the present time however, the DC1700 is still the cheapest equivalence product on the market.
The DC1700 is an optical particle counter. The operating principle is actually quite simple:
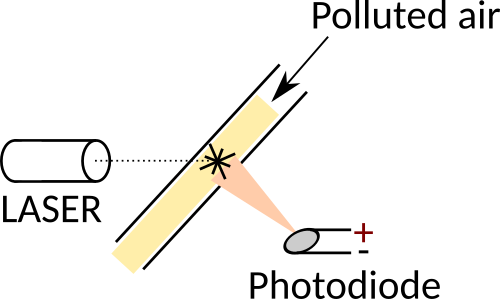
- Polluted air is directed via a fan and ducting to intersect the path of a laser beam.
- Perpendicular to the laser beam is placed a photodiode.
- When a pollution particle intersects the laser beam, laser light is reflected off it onto the photodiode.
- The photodiode produces a voltage which is proportional to the amount of light reflected onto it.
Since the amount of light a particle reflects is proportional to its size, the response of the photodiode indicates the size of the particle involved. By continously sampling the (amplified) photodiode output, the number and sizes of particles can be counted.
Note that in practice various assumptions dictate the accuracy of the method: such as the reflective index of the particles for the wavelength of the laser and so on, but as an equivalent metric for PM2.5 and PM10 measurement, optical particle counters work very well.
The DC1700 in particular is a bit outdated with regards to its design:
- It uses a NiCad battery instead of a lithium based battery which takes 6-8 hours to charge.
- The RS232 interface API has only two functions:
- Once a minute the average reading is spat out as ascii.
- The entire dataset can be requested by sending a control code to it.
- The RS232 interface has no threads for permanent attachment of a wire.
- It is bulky and difficult to mount and use in certain manners.
Despite these shortcomings it is the best unit available at present for the cost.
Data collection box
The DC1700 is actually not useful on it’s own as a hassle-free data collection unit since all it does is log data to an internal memory, and spit out average readings once per minute to the RS232 port.
Given that we purchased five units, and have tens of volunteers using them, it would be an enormous timesink to manually download the data at the end of every day. Furthermore, the data is only timestampted by the DC1700, so we would have to manually label the data with each location monitored, based on a log taken by the volunteer.
Whenever you introduce complexity, it reduces the chance of actually getting anyone to help, and reduces the availability of the data.
I wanted something which could meet the following criteria:
- Be easy to use by volunteers of all age ranges and capabilities:
- Have a very simple user interface.
- Have a display to indicate status and instructions.
- Be easy to extract data from:
- A mechanism to label the data at the point of collection.
- A mechanism to upload the data automatically to a cloud database.
- Be portable:
- Having a battery that will last all day.
What follows is a description of the design and how it meets these criteria. The design will make more sense if you understand how the volunteers use it, since the design and metholology were systems-engineered simultaneously.
Operational model
Each of the five collection units comes as a pair of one DC1700 and one data collection box:
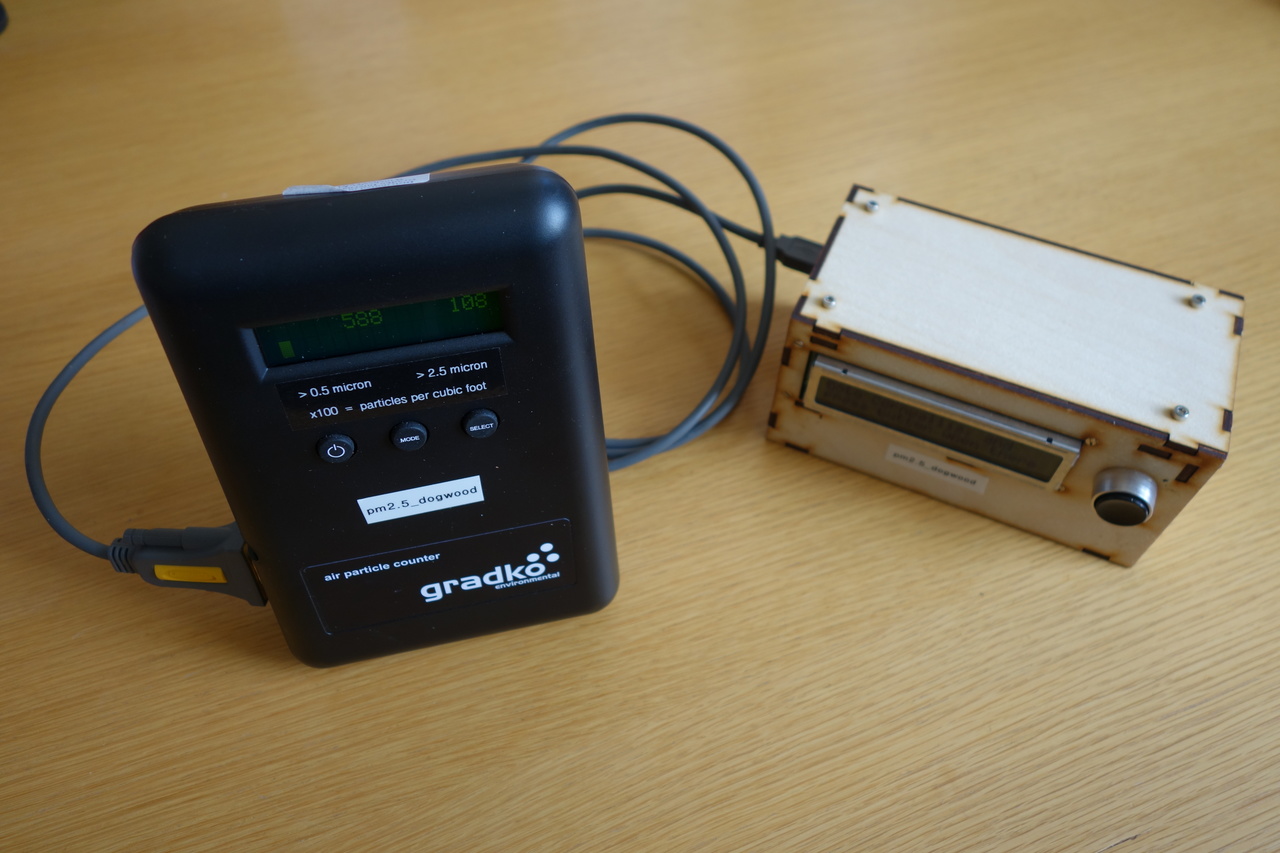
The operational model for collection proceeds as follows:
- Volunteer picks up the equipment from the exchange point.
- Volunteer goes to the designated monitoring location according to the schedule.
- Volunteer takes the equipment out of the bag.
- Volunteer ensures DC1700 is connected via USB to the collection box.
- Volunteer sites the DC1700 and box for optimal monitoring according to the instructions for selected location.
- Volunteer switches on both the DC1700 and the collection box.
- Collection box screen indicates readiness and asks for button push.
- After button push, volunteer chooses a location by:
- Pushing button to cycle through locations which are displayed on the screen.
- Waiting five seconds on a displayed location to select it.
- Volunteer waits for one hour at selected location, using the countdown on the screen as a reference.
- Volunteer swiches off the equipment.
- Volunteer returns equipment to exchange point.
Now we will focus on the design of specific elements of the collection box.
Interface
The front of the collection box consists of a 24x2 backlit LCD display whose display driver is Hitachi HD44780 compatible. The HD44780 is incredibly easy to drive and libraries for doing so abound. This particular screen isn’t fantastic in terms of visual clarity or power consumption, but it did have one defining characteristic: cost - the makerspace had a box of these going for free.
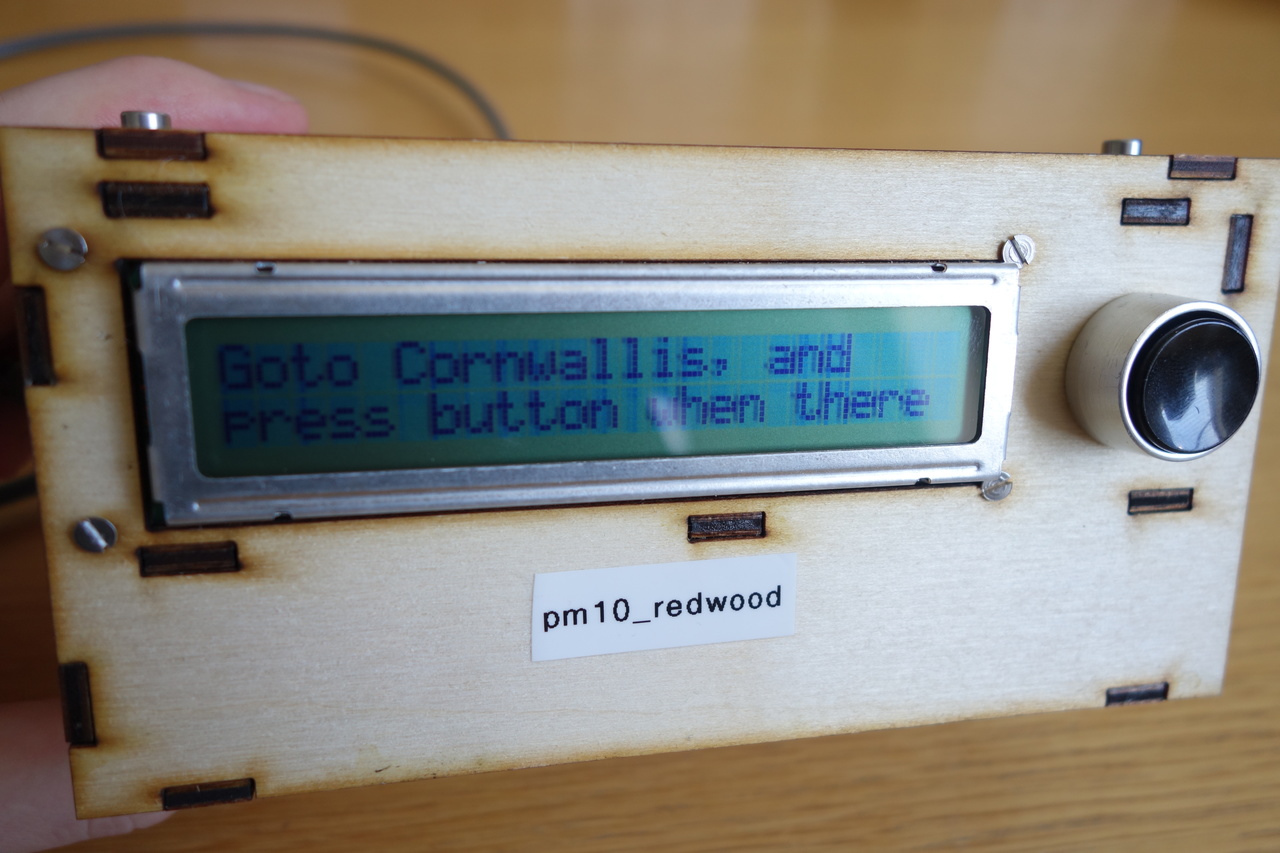
The display is big enough to show simple instructions such as that seen in the image “Goto Cornwallis, and press button when there”, which is all it needs to do.
In addition to the display is a single large tactile button, ingressed into a circular surround to reduce accidental pressing. All of the box operations must therefore rely on being able to use a single button, which practically means that actions are reduced to three possible choices:
- Pressing the button.
- Holding the button for a fixed amount of time.
- Not pressing the button within a given time window.
Despite these limitations, the single button is sufficient to provide all operations the box needs.
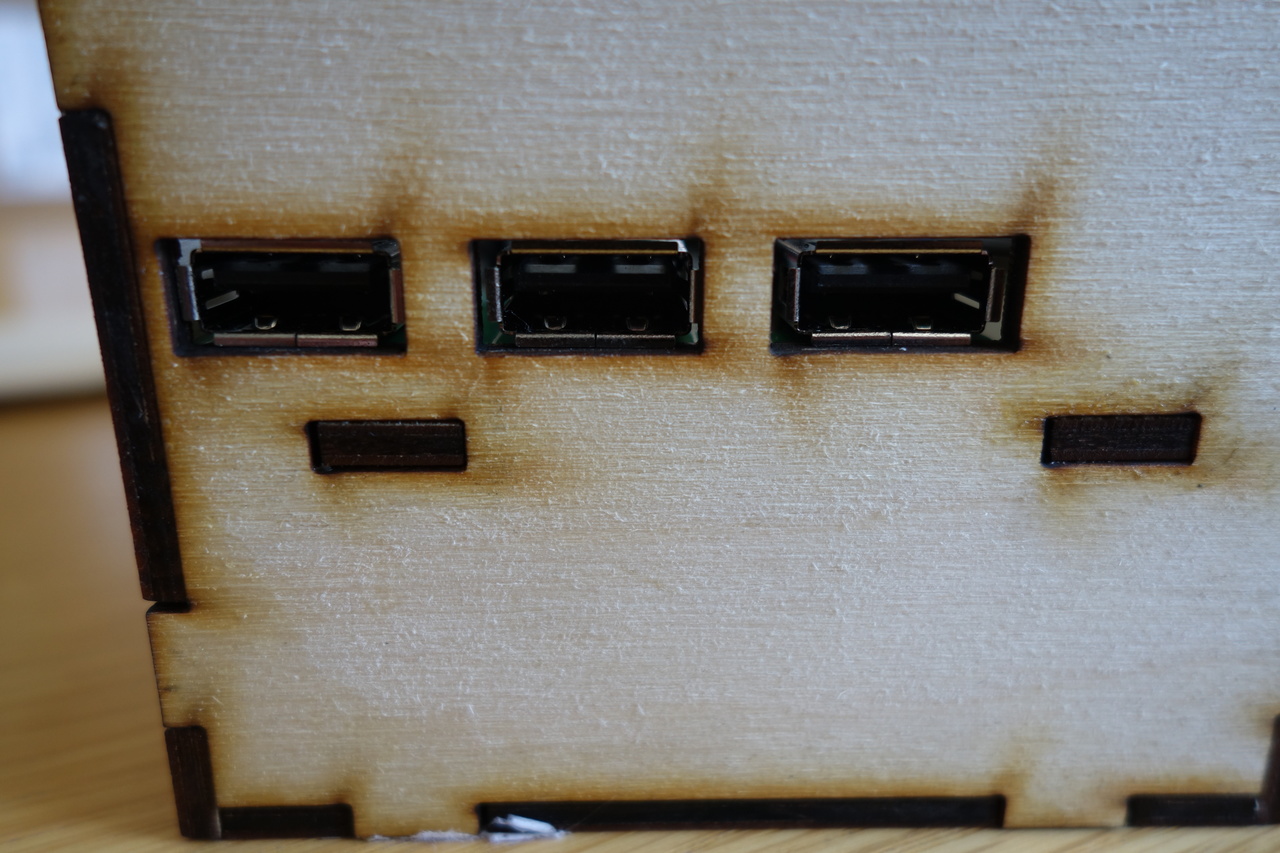
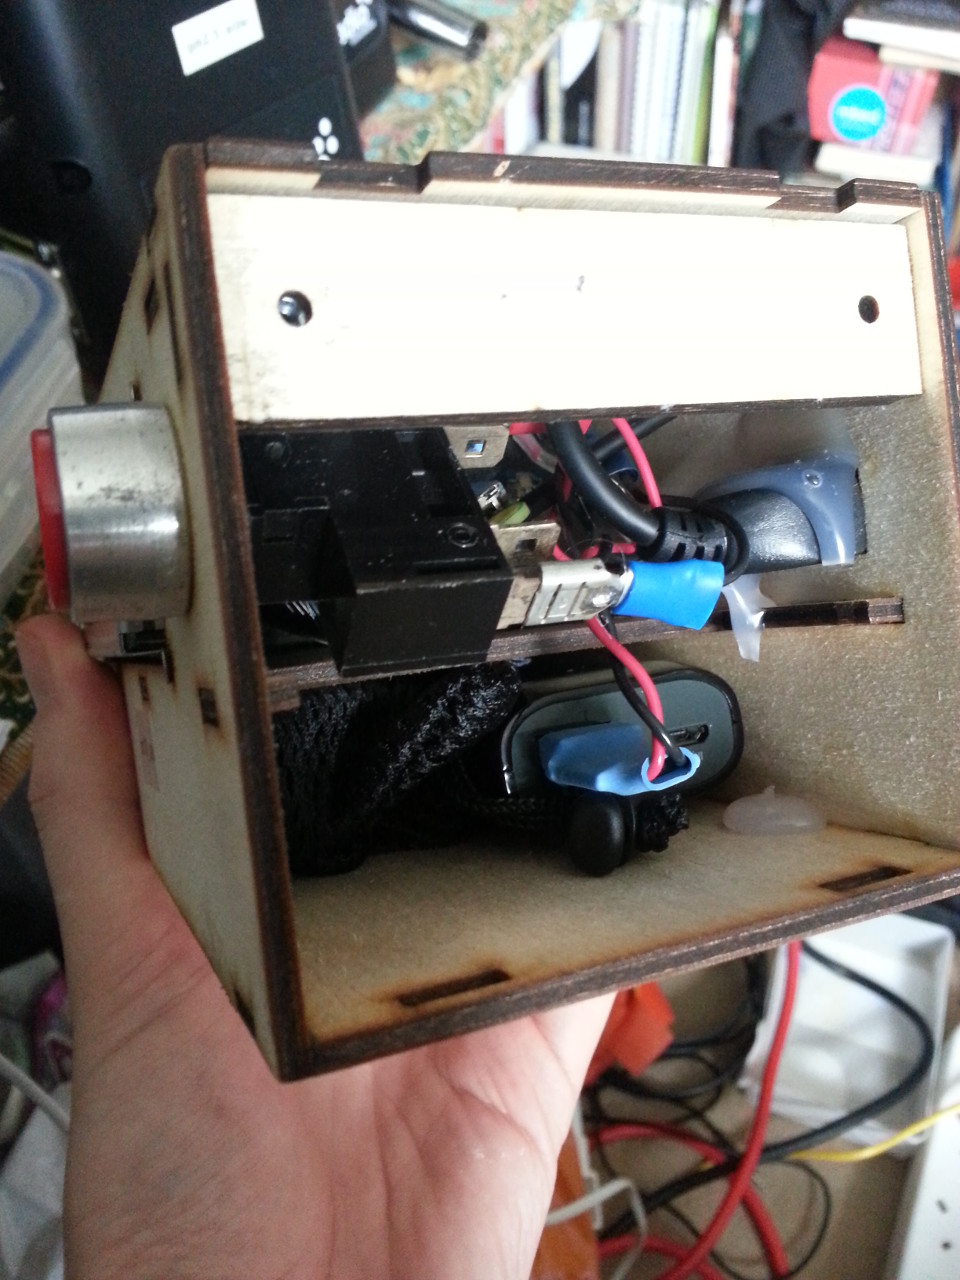
The DC1700 is connected to the collection box via any of the USB connections exposed on the side of the box:
On the back of the box is simple inline switch to turn it on and off and a charging port to charge it:
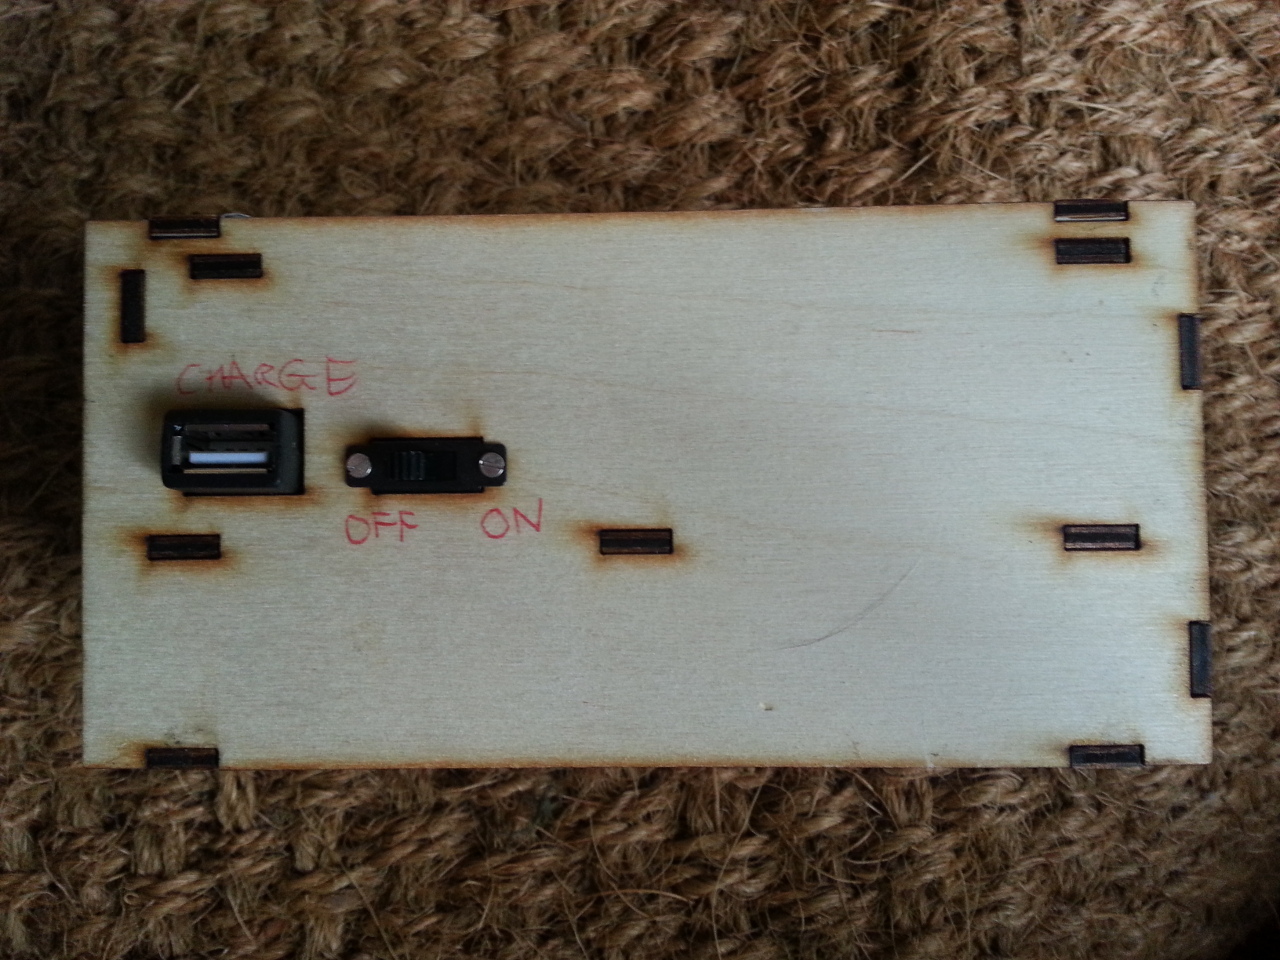
Please excuse the crudeness of the labelling; the other units have printed labels but this one was handed to someone to use in a rush so I had to quickly scribble the labels. In retrospect, I could have laser-scribed the labels directly into the plywood box.
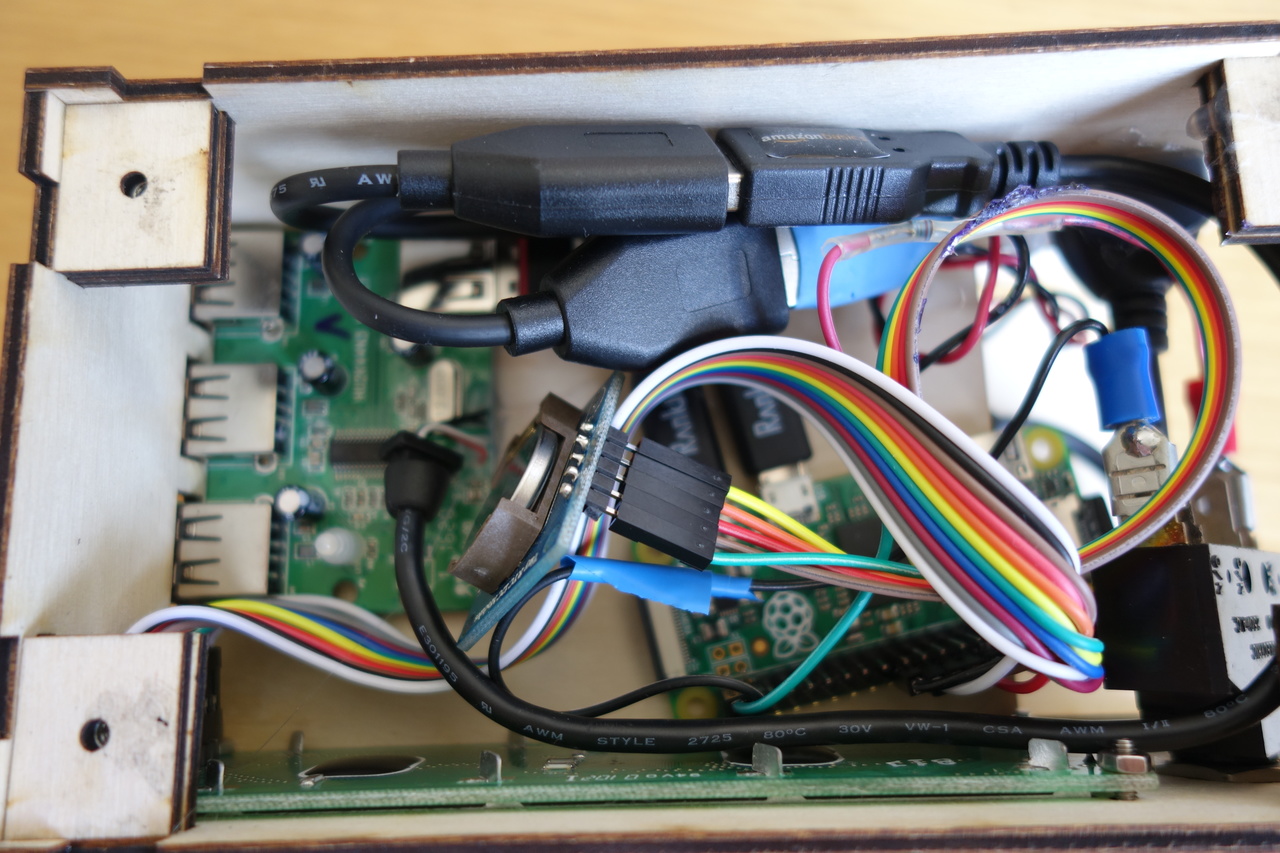
Hardware components
The hardware is pretty simple and consists of:
- A raspberry pi zero for computation.
- A USB hub for the wireless dongle and DC1700 connection.
- An RTC to keep track of time.
- An LCD screen.
- A button to control operation.
- A rechargable battery.
These are all shoved inside the plywood box and glued in place with hot-glue, or in the screens case; bolted to the box.
Pi zero
The raspberry pi zero was chosen because it provides the most bang per buck of any “embedded” processor on the market. At £4.00 per unit, there really isn’t anything that can compete for rapid prototyping. The only other computer I seriously considered was the ESP8266 wifi module, with a pricetag of £3.43 per unit. This would have mitigated the need for a separate wifi dongle and microSD card, but the cost of the additional power and connection circuitry would probably have eclipsed the cost of these anyway, not to mention the added hassle. The raspberry pi zero was the best choice for this project because:
- It can be connected directly to a standard 5V USB power pack.
- It has a USB host so can attach to the DC1700 and wifi dongle.
- And it can do so without having to solder those components.
- It has enough GPIO pins to drive the screen and the button.
- It runs a full OS and thus benefits from a vast array of software that is regularly updated.
- It only draws 200mA when operating.
Remember, one goal here is cheapest cost. Whilst I am confident I could make a smaller and cheaper bespoke unit, the design time and assembly time would increase enormously. We are not manufacturing a product for mass production here, but rather a few units for a data-collection project on a very tight budget.
RTC
In order to be able to maintain time through resets, the pi is connected to an DS1307Z RTC:
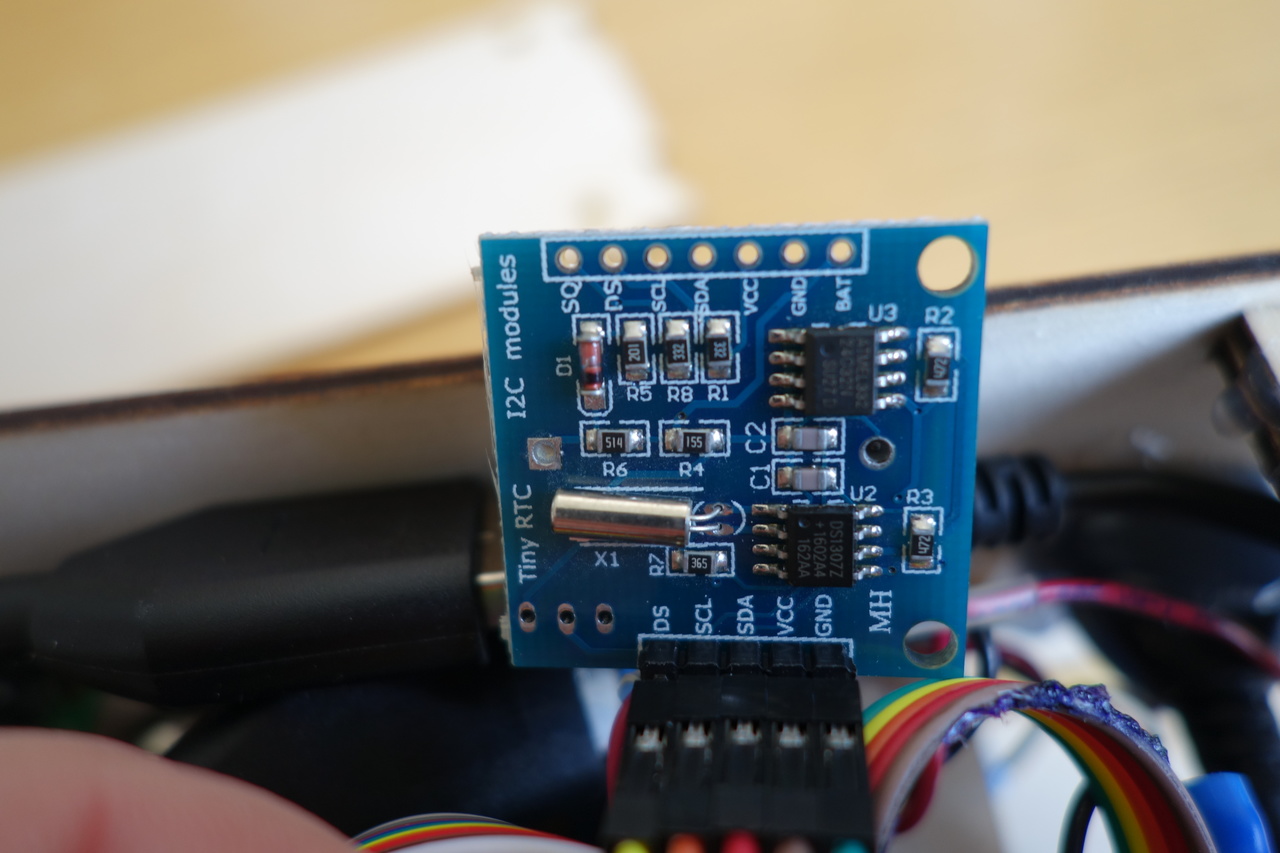
This has the advantage that it is natively supported in Linux on the raspberry pi, and so the system time can be set from it on boot. We need real-time that persists through power-cycles is because the DC1700 interface is garbage and outputs un-timestamped data at one-minute intervals. We need to label each datapoint with time ourselves.
Battery
The battery for the collection box is an Anker Astro E1:
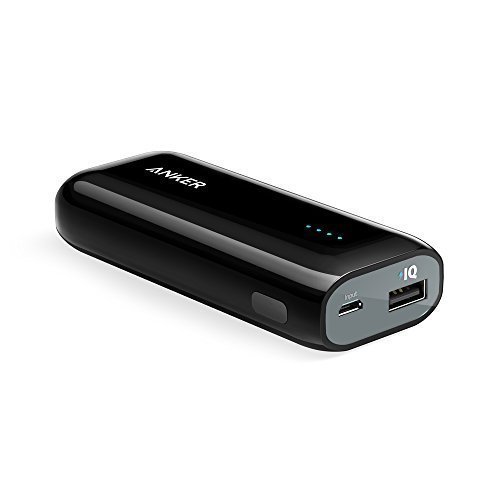
This has a 5200mAh capacity. Annoyingly, it cannot symultaneously supply power and charge, which makes it much more of a hassle to upload data from the unit when it’s back at the exchange point at the end of the day. If it had been the case that the battery could charge whilst the unit was on, it could upload its data whilst charging. Instead the unit has to be left on until it uploads its data, and then switched off for charging. This is something I explicitly had attempted to avoid, and based my assumption on a 10000mAh Anker charger which we had lying around in the lab and which did allow symultaneous charging and use. I won’t make that mistake again.
Since the box with all peripherals draws no more than 300mAh even when uploading data, the box will last for at least 16 hours. This gives plenty of scope for additional peripherals. The battery compartment is big enough to hold a bigger battery if necessary:
However, the main limitation is the battery of the DC1700, which only lasts 5 hours.
Button
In the above picture you can see the button also, this is wired from the pi’s 5V supply with an inline 10k resistor to a GPIO pin using the interal pull-down resistor for the input. The button is a simple normally-open switch.
Enclosure
The enclosure is made of laser-cut 3mm plywood that has been glued together with wood glue.
Software
Because the hardware uses a raspberry pi zero, it is possible to write control software that is much more sophisticated than the equivalent embedded software for a given amount of work input, because of the plethora of existing libraries and OS primitives available. For example, we can take advantage of the journaling capabilities of ext3 to provide some assurance against data corruption, which would require a bespoke implementation in the embedded world, or in the best case messing around porting some existing library.
Architecture Overview
The image below shows a diagram of the software components:

- The main program is the control process which performs the following actions:
- Spawns the data collector and data sender processes
- Controls the LCD to direct the user and receives input from the button to initiate actions (such as choosing a collection location, or starting collection).
- Notifies the data collector what the current collection location is according to that selected by the user.
- Starts the data collector when instructed and stops it when the collection time is elapsed.
- The data collector processes is started whenever a volunteer presses the button after reaching their chosen location for data collection. The data collector works as follows:
- Wait for data from DC1700.
- Receive data.
- Label data with collection location and timestamp.
- Put labelled data on the shared stack.
- Goto 1 until stopped by control thread.
- The shared stack is an in-memory FIFO stack that supports concurrent access. The reason for using a stack is that I reasoned that as a general purpose data structure for sending sensor data, more immediate data should be considered more important and thus sent first when possible. It can also be used as a queue if that suits the application. The shared stack is persisted to an sqlite3 database to provide (as reasonable as can be expected from the OS) ACID guarantees. This should ensure that data persists through unexpected resets etc. The shared stack sends events to listeners when actions are taken on it. The shared stack can store arbitrary data as long as it is provided with appropriate (de)serialisation functions.
- The final piece of the puzzle is the data sender. This is a pluggable module which initially was a LoraWAN sender, but then I reverted to WiFi when I realised the LoraWAN deployment a colleague was developing wouldn’t be ready in time. The data sender removes data from the shared stack and sends it to the backend over WiFi, whenever WiFi is avaiable. If it runs out of data to send it sleeps until it receives an event from the shared stack indicating that new data is available.
By decoupling each of the processes, it makes it easy to configure the control flow, collection methodology, sending transport independently.
References
- [1] Holgate, Stephen T. “‘Every breath we take: the lifelong impact of air pollution’ - a call for action”" Clinical Medicine 17.1 (2017): 8-12.
- [2] Steinle, Susanne, et al. “Personal exposure monitoring of PM 2.5 in indoor and outdoor microenvironments.” Science of the Total Environment 508 (2015): 383-394.